

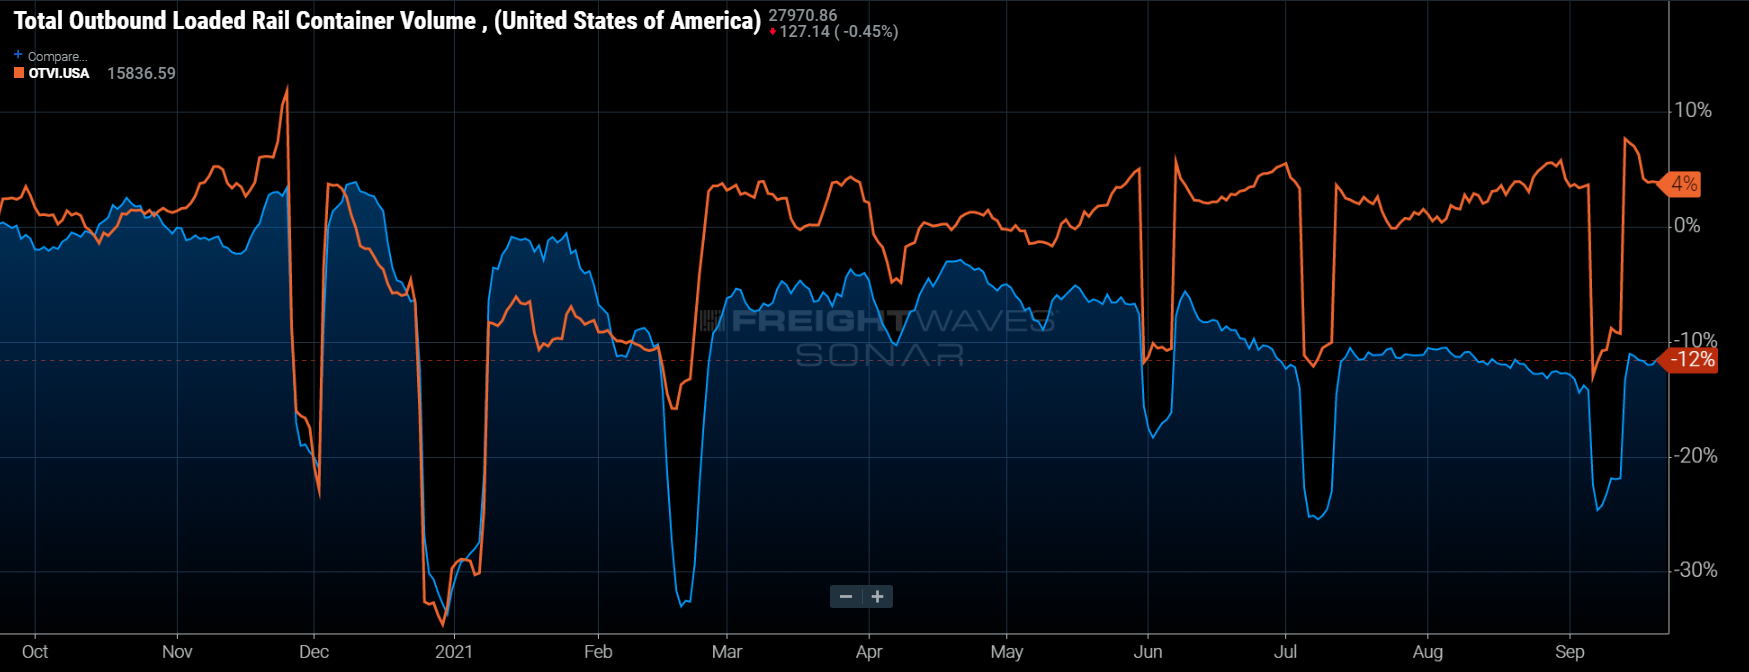
Chart of the Week: Outbound Loaded Rail Container Volume Index, Outbound Tender Volume Index – USA SONAR: ORAILL.USA, OTVI.USA
The National Outbound Tender Volume Index shows a 4% year-over-year growth rate compared to the Outbound Loaded Rail Container Volume Index’s (ORAILL) 12% decline. With demand for surface transportation remaining consistent, this is a not so subtle indication that shippers are choosing trucks over trains when rail container volume is supposed to be on the rise.
Traditionally speaking, intermodal container shipping on the rail hits its stride late in the third/early fourth quarter, while this year is showing the opposite trend. According to American Association of Railroad data, intermodal container volumes are about 5-10% higher in mid-September than in mid April. This year, volumes are about 8.5% lower.
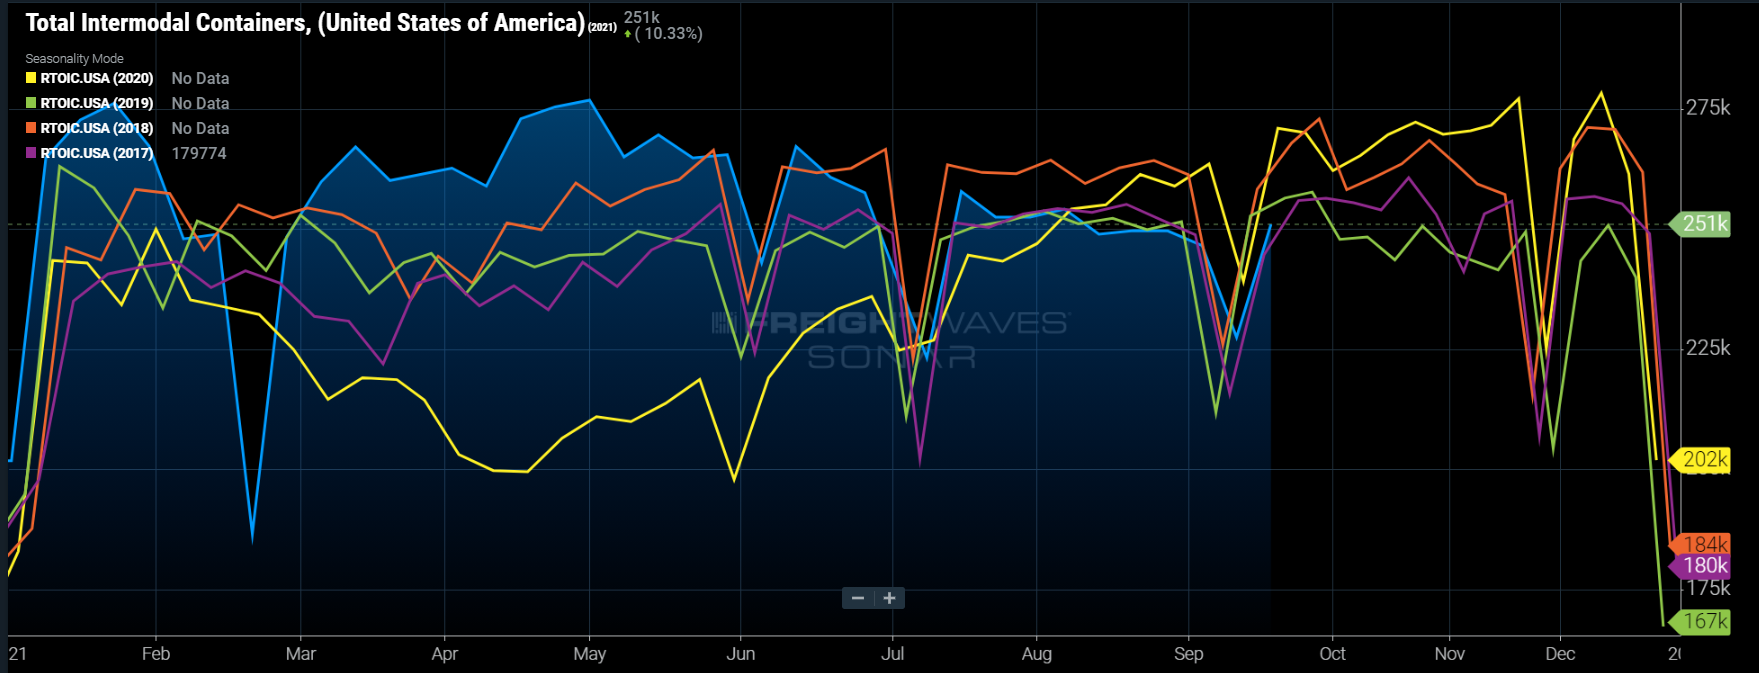
Adding to that statistic, container volumes are the lowest they have been since 2017 for the week following the Labor Day holiday period. “Rail volumes have not suffered because of a lack of demand,” Mike Baudendistal, FreightWaves’ rail and intermodal expert said on this week’s Freightonomics episode. Port and intermodal terminal congestion combined with a lack of drayage capacity were some of the main contributors driving service deterioration on the rail lines this past summer. But wait, isn’t truckload capacity also challenged?
The answer to that question is a definitive yes. Spot rates are up approximately 20% year-over-year according to Truckstop.com’s top 100 dry van lanes. National tender rejection rates (the percent of shippers’ load requests rejected by carriers electronically) have been above 20% for over a year. The average rejection rate in 2019, a year when capacity was readily available, was around 6%.
Shippers are having similar difficulties with trucking capacity, but there are far less potential points of failure when booking a load on a truck versus moving it on the rail. Many shippers are already operating from behind and cannot afford to chance additional delays to rebuilding depleted inventories prior to the peak retail season that is just around the corner.
Shippers have resorted to moving freight in shorter increments, either because capacity is easier to source or because they are trying to make room for all the freight that is coming into the country by moving it into staging facilities close to their ports of entry. Perhaps the best example of this can be observed coming off the West Coast, where the gross majority of imports enter the country.
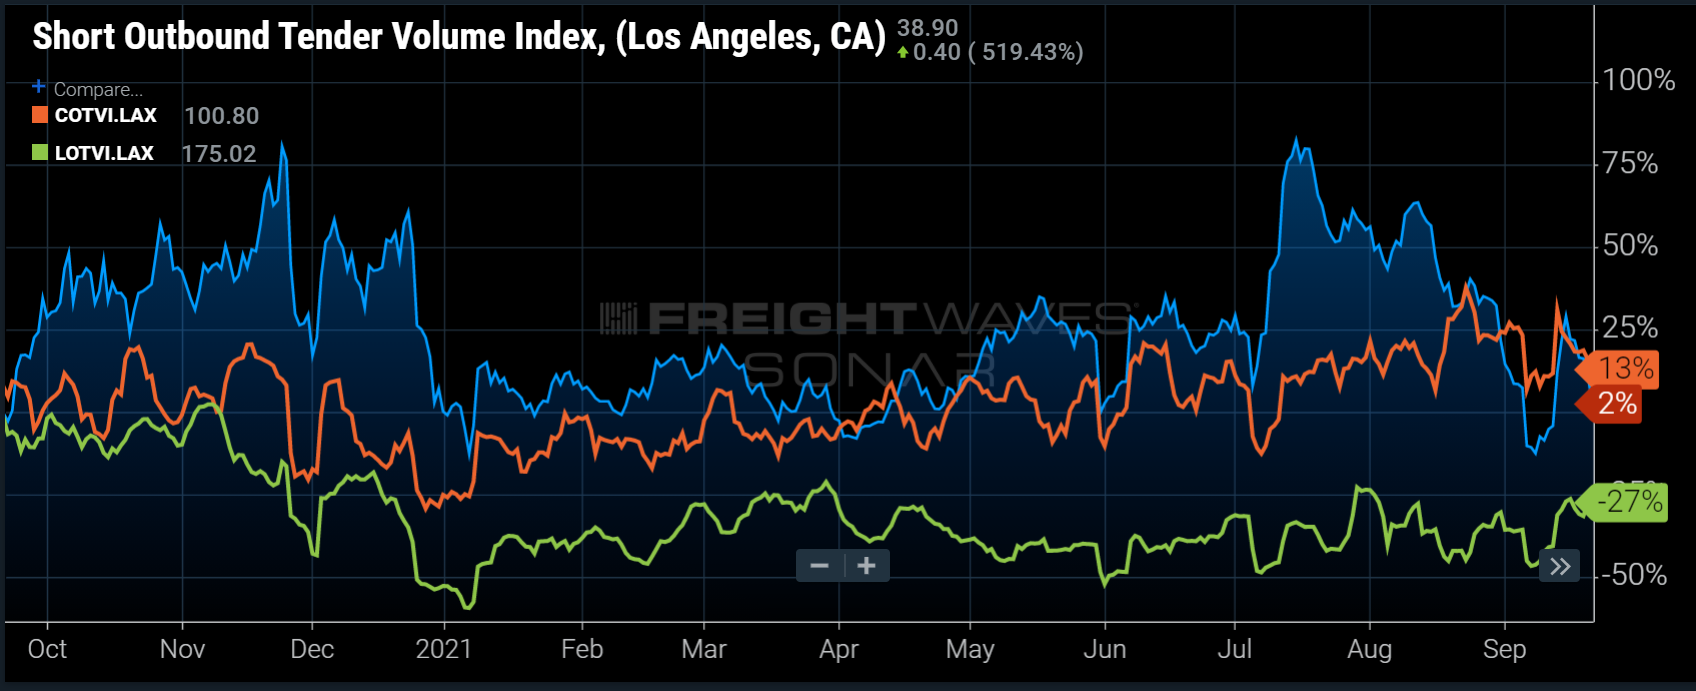
The Los Angeles market’s local (<100 miles) and short-haul (101-250 miles) tender volume indices have averaged 39% and 15% higher since the first of August versus last year, while long-haul (>800 miles) tender volumes have averaged 26% lower. This trend started in April, about the same time as loaded container rail volumes began their descent.
Shippers have to be creative in the climate of extended limited capacity. It is easier to place an order than to move the goods. If they can’t ship them across the country, they at least need to get them out of the way. The path of least resistance has been to move it shorter distances, as is evidenced by the huge discrepancy in local and long-haul tender rejection rates this summer.
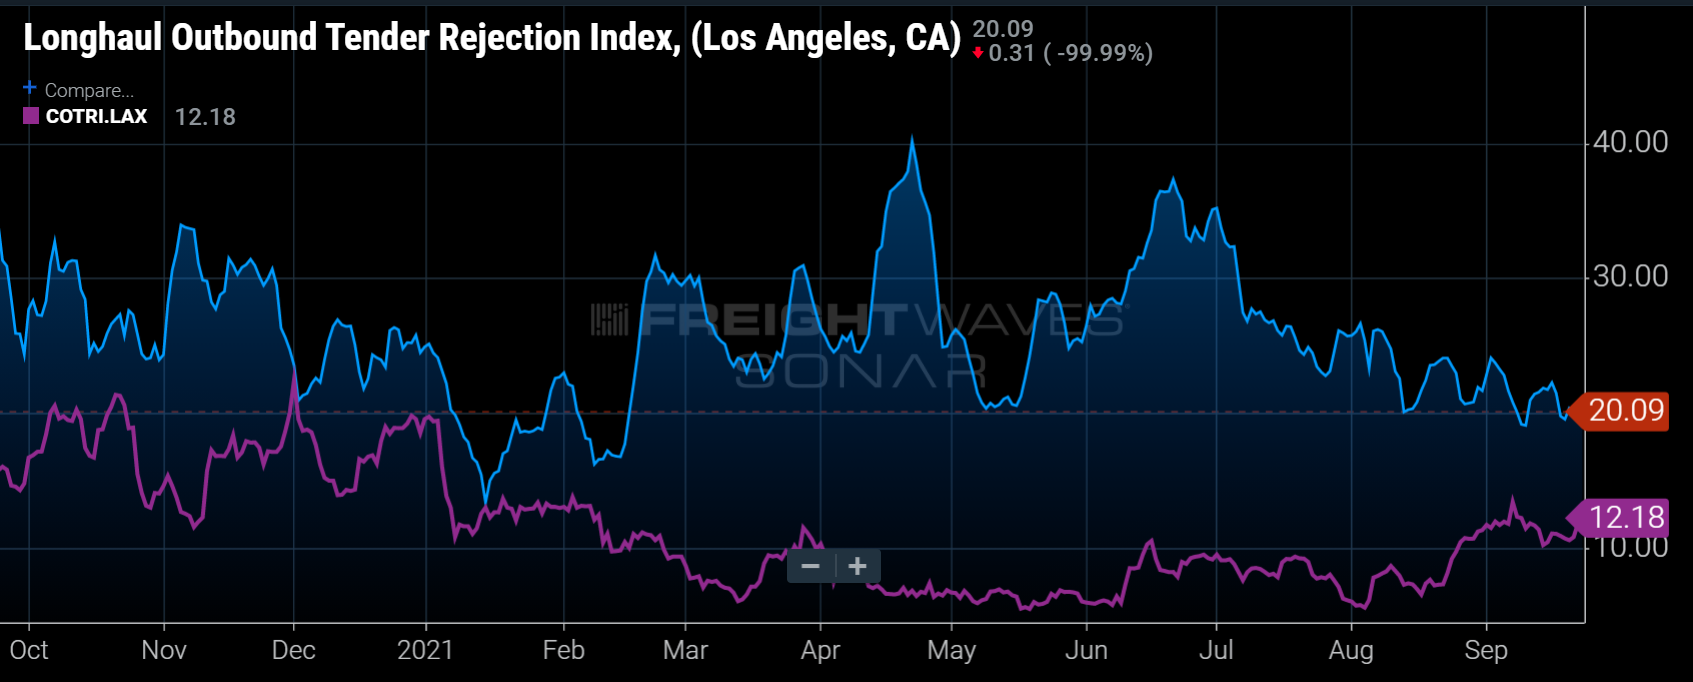
Long-haul rejection rates have been trending slightly lower over the past few months out of Los Angeles. This is potentially a slightly positive sign for shippers as time is running out to get their orders in place for the holiday peak season, which in a way may already have arrived for transportation providers.
About the Chart of the Week
The FreightWaves Chart of the Week is a chart selection from SONAR that provides an interesting data point to describe the state of the freight markets. A chart is chosen from thousands of potential charts on SONAR to help participants visualize the freight market in real time. Each week a Market Expert will post a chart, along with commentary, live on the front page. After that, the Chart of the Week will be archived on FreightWaves.com for future reference.
SONAR aggregates data from hundreds of sources, presenting the data in charts and maps and providing commentary on what freight market experts want to know about the industry in real time.
The FreightWaves data science and product teams are releasing new data sets each week and enhancing the client experience.
To request a SONAR demo, click here.
Packers and movers in peenya Packers and movers in peenya Packers and movers near me Packers and movers near me Packers And Movers Banashankari Bangalore a Packers And Movers Banashankari Bangalore a Packers And Movers Jayanagar Packers And Movers Jayanagar Packers and movers Yelahanka Packers and movers Yelahanka Packers And Movers Btm Layout Packers And Movers Btm Layout Packers And Movers Koramangala Packers And Movers Koramangala Packers And Movers Hsr Layout Packers And Movers Hsr Layout Packers And Movers Bommanahalli Packers And Movers Bommanahalli Packers And Movers Begur Road Packers And Movers Begur Road Local Packers And Movers Bangalore Local Packers And Movers Bangalore Packers And Movers Ramamurthy Nagar Packers And Movers Ramamurthy Nagar Packers and movers Bangalore Packers and movers Bangalore